WordPress is a very robust and reliable Content Management System. Yet, at times, things can do wrong even in spite of WP’s robustness. One faulty plugin or a poorly-coded theme is all it takes to bring your site down. In such cases, how do you figure out what is wrong? Out of the tens of plugins that you have installed, which one do you pinpoint to be at fault? Query Monitor can make life easy for you in such scenario.
In this article, we will learn what Query Monitor is and how we can read its results to assess and analyze what might be going wrong on our WordPress website.
Using Query Monitor to Debug Your WordPress Website
What is Query Monitor?
Query Monitor is a free WordPress plugin that is used mainly for debugging and developmental purposes. As such, it can monitor and keep track of calls and requests that are made to and from your website to the WordPress database. In this manner, should something go wrong, such as an incorrect call or request that affects the performance of your website, Query Monitor can help you locate it easily.
Here is a non-exhaustive list of things that Query Monitor can keep track of:
- AJAX calls
- REST API requests
- Hosting environment details
- Query tags made by the current page
- Details about WordPress hooks and conditional tags
- And a lot more!
As the name suggests, this free WP plugin essentially keeps track of the queries that are made to your WP database. Now, you might be wondering: how can this plugin help you locate issues with your WordPress website? Well, almost everything related to your WP site tends to make queries to your database. Say, you installed a new plugin — it will make queries to fetch and send data to and from your database. Naturally, should some query go wrong, problems will arise. Query Monitor helps you locate and isolate such problems.
How to Use Query Monitor?
Using a plugin such as Query Monitor might seem like a daunting task for a beginner. However, once you get accustomed to it, you will realize that the plugin is actually fairly simple and easy to use.
Upon activating Query Monitor, you will notice some additional information in the WordPress admin header bar.
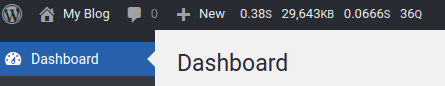
This info is as follows:
- Time for page load
- Peak PHP memory usage
- Total time for database queries
- Total database queries that were made.
The most obvious way to pinpoint if something is going wrong on a given page is to look at the PHP usage — if it is very close to or higher than what your web hosting provider is allowing, your website will freeze or go down. This is especially true if you are on a shared hosting package.
After you hover over the header info bar, you will notice a drop-down menu. This menu will provide you access to various details about database queries.
But before going any further, see for another obvious detail — are there any duplicate queries being made? Duplicate queries are made, generally, when one or more plugins issue the same query to your database. Naturally, these consume memory recursively and should better be avoided.
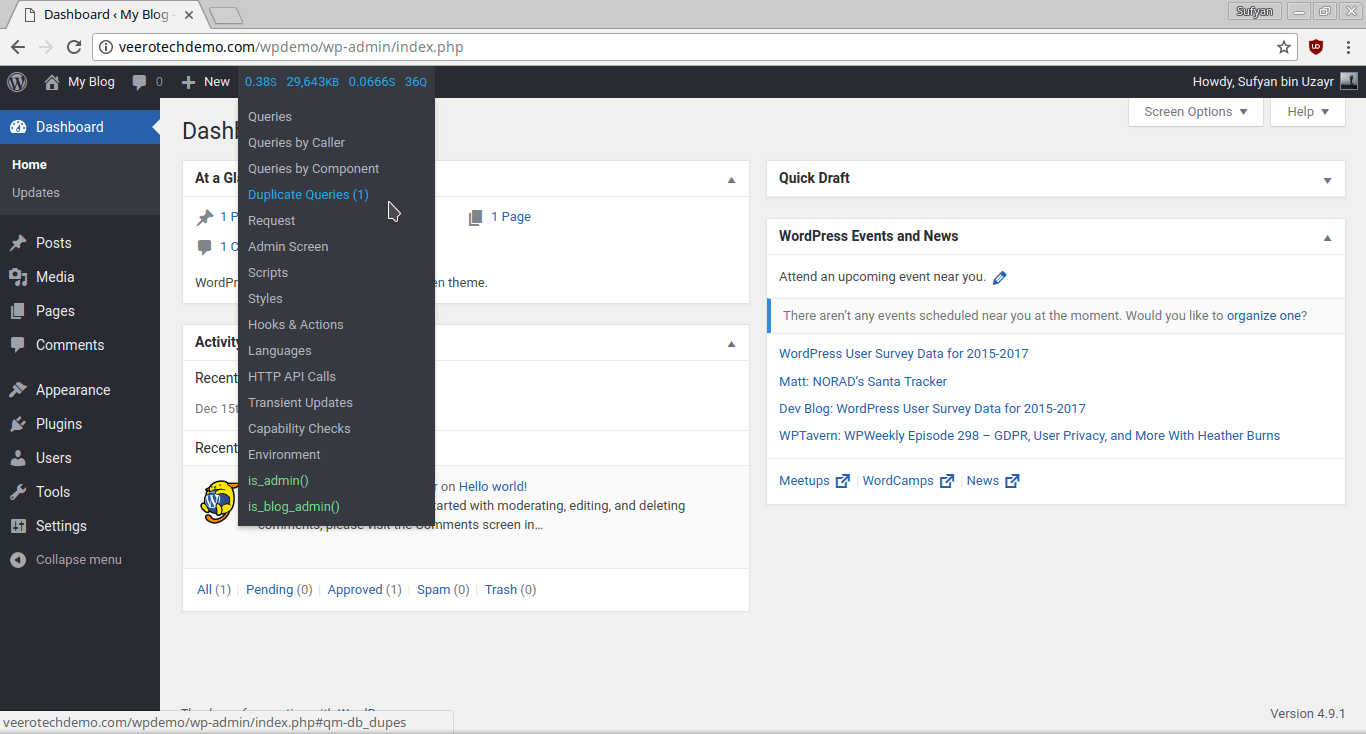
You can then click on any entry that you wish to view the details for. Thereafter, feel free to scroll through the page at length — Query Monitor gives all the results on the single page but you can navigate by means of titles and headings.
Any anomaly, such as excess memory usage or unsatisfied dependency, will be easily visible on the page. Note that, however, not all errors are critical. Some may just be warnings — JavaScript dependencies will be critical, whereas generic dependencies will be mere warnings.
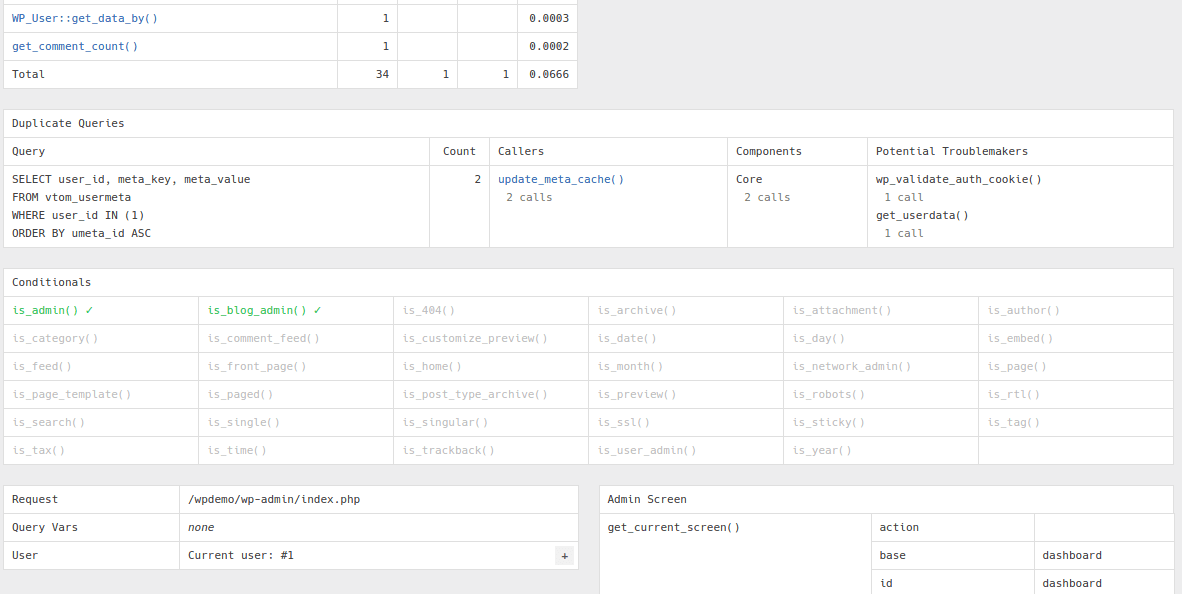
The easiest way to pinpoint issues are to look at the “Callers” column and see the calls that were made by plugins. If there are multiple errors or faults associated with a given plugin name, you can safely deduce that the given plugin is causing issues on your WP website.
Conclusion
Query Monitor is primarily used by WordPress developers to build better and more reliable themes and plugins for WordPress. However, it is an effective and reliable debugging tool as well as it can point out faulty calls that were made to the database.
As a result, if you are facing repeated issues with your WordPress website, the best bet is to rely on Query Monitor to first attempt to figure out where the problem might lie. Since this plugin can tell you at length as to which call was made by which plugin or theme or core file, and also showcase the memory consumption for each, debugging becomes a lot easier.
Download Query Monitor from WP.org for free.
If you have any web hosting questions please feel free to reach out to us. We're happy to help.