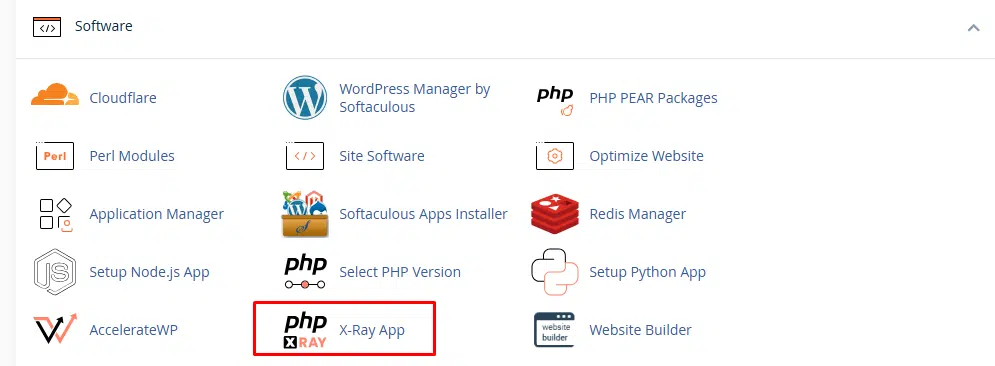
Access the X-Ray App in cPanel
Start by logging in to your cPanel account and navigating to the Software section. Locate and click on the X-Ray App icon. This dashboard serves as your command center for all performance traces, showing you a history of past sessions and allowing you to initiate new ones for real-time debugging.
X-Ray App in cPanel
Configure and Start a New Trace
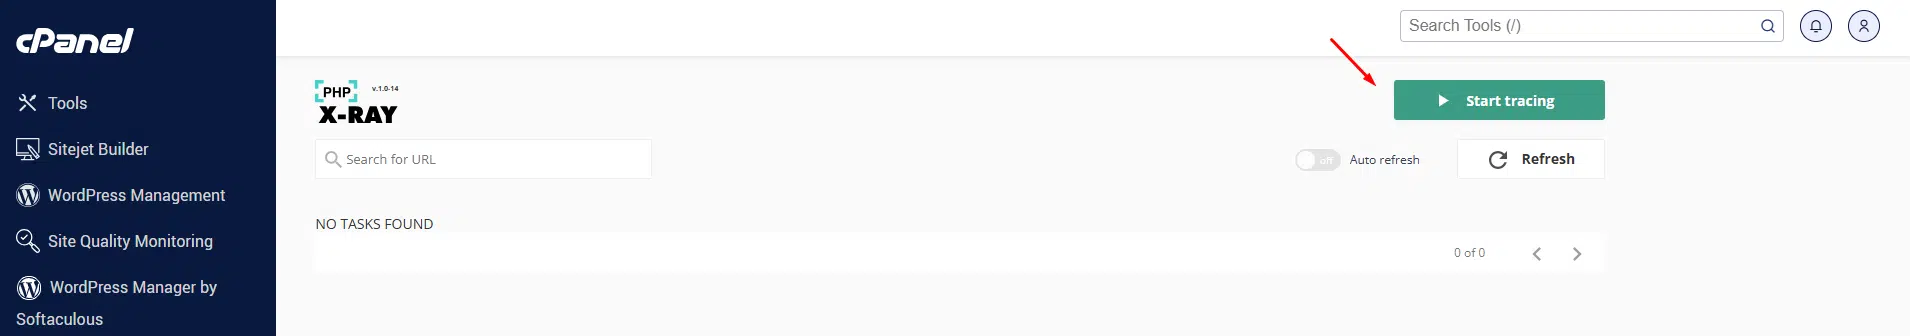
Click the Start Tracing button to open the configuration screen.
X-Ray App in cPanel
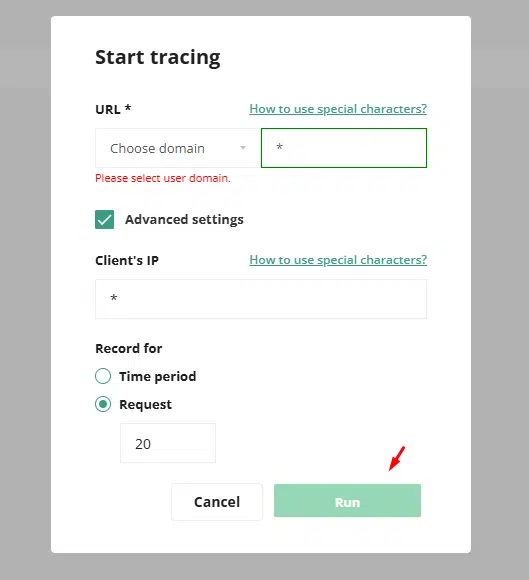
Here, you will define the parameters for your test. Select the domain you want to analyze and enter a URL Mask; use / to trace the homepage or * to capture traffic across the entire site. You can also specify your own Client IP to ensure the tool only records your specific testing session. Once you have set the expiration time and the number of requests to save, click Run to put the tracer into an active state.
X-Ray App in cPanel
Generate Website Traffic
PHP X-Ray is a passive listener, meaning it only records data when someone actually visits the site. While the trace status shows as Running, open a new browser tab and visit the page that is experiencing slowness. You may want to refresh the page a few times or use a tool like curl via terminal to generate several requests. This ensures the X-Ray App has enough data samples to provide an accurate breakdown of the performance issues.
X-Ray App in cPanel
Understanding the Trace Status
During or after tracing, you may see different statuses for the task.
-
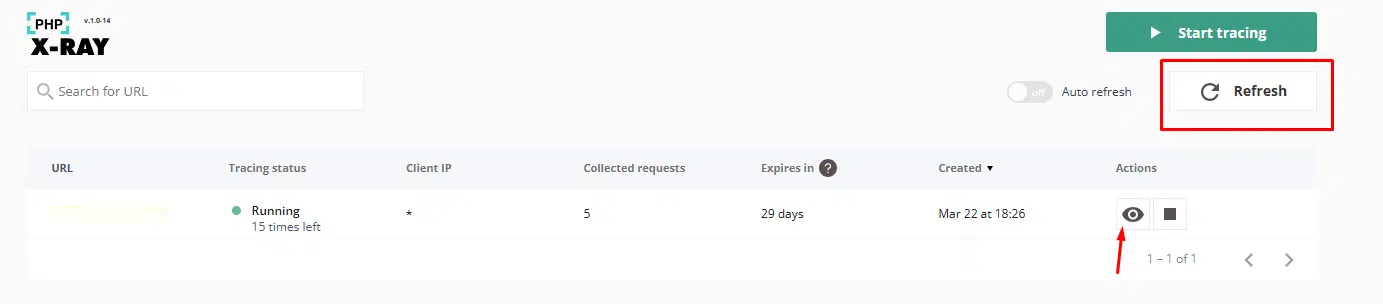
Running: The tool is actively waiting for and recording website visits.
-
Stopped: The trace was manually ended by the user.
-
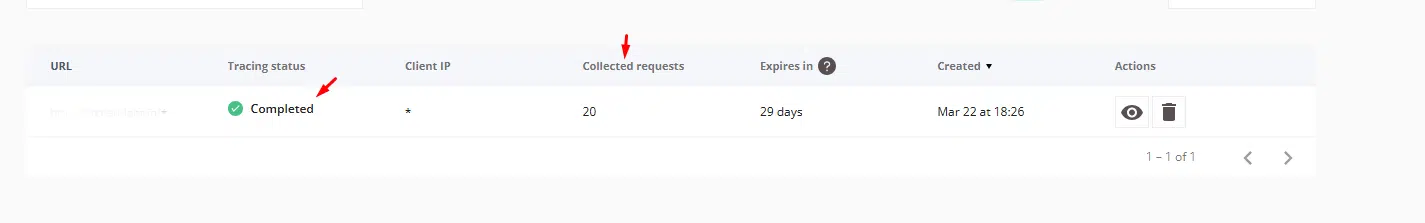
Completed: The session finished automatically after reaching the time limit or request count.
-
On Hold: The task is paused and requires manual intervention to proceed.
The trace list may also show details such as the selected URL, client IP, collected requests count, expiration period, and creation time
X-Ray App in cPanel
Reviewing the Results
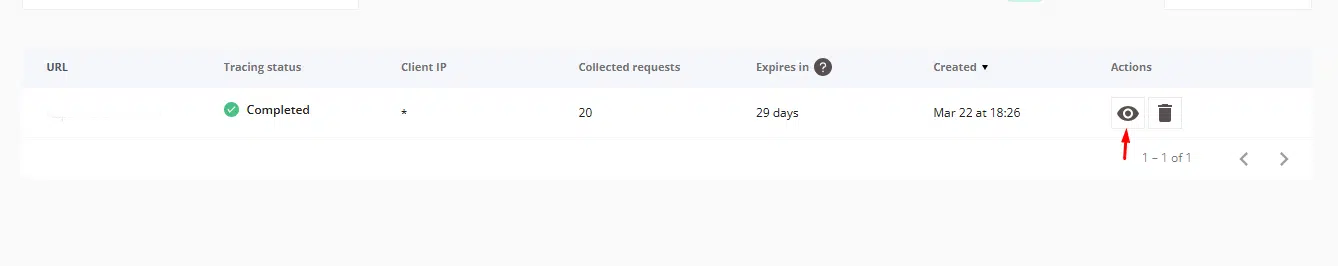
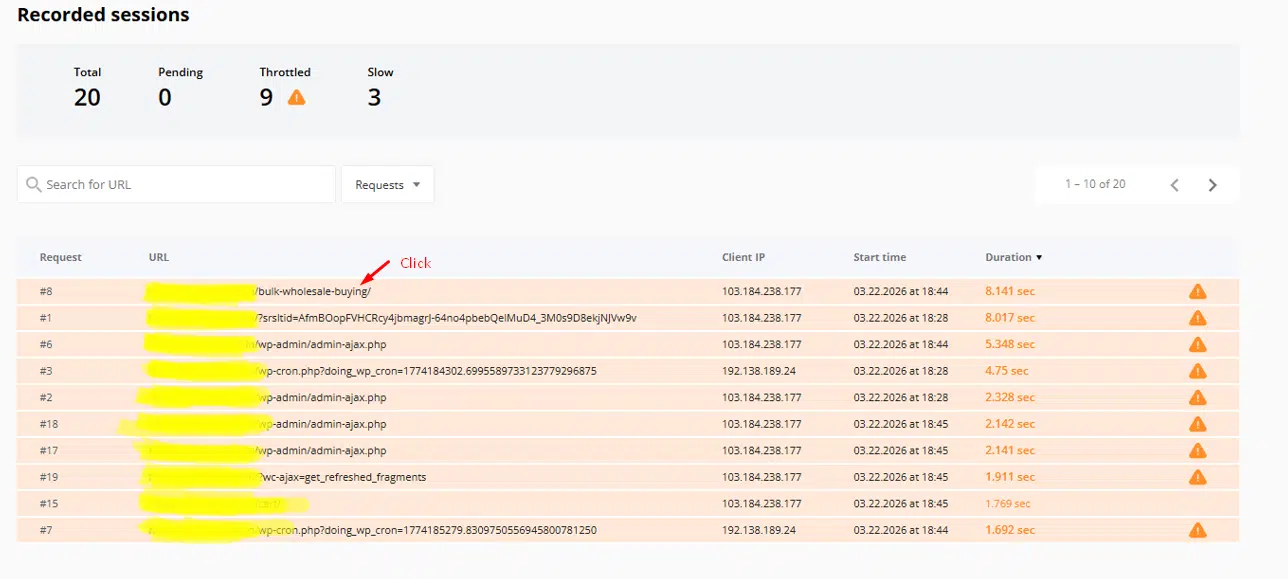
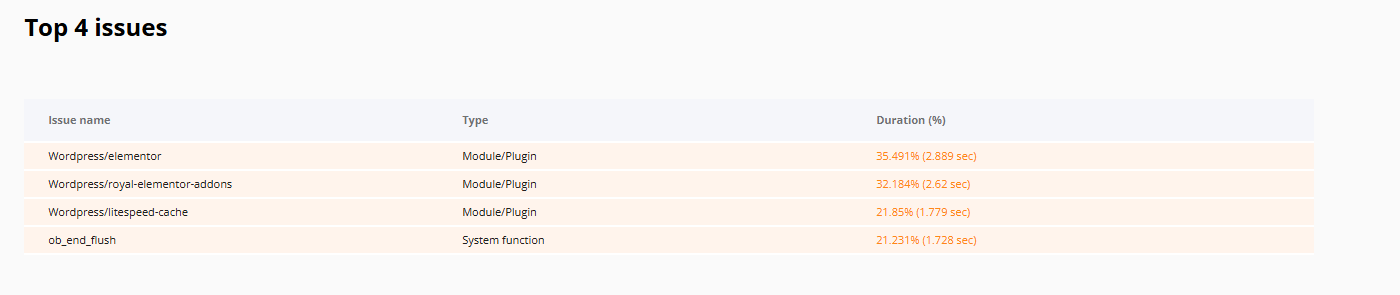
After opening the trace results, click a recorded request to view its detailed breakdown. One of the first sections to review is Top Issues, which highlights the main contributors to slow performance.
X-Ray App in cPanel
The Top Issues section can quickly point to the main bottleneck for that request. For example, the Veerotech guide shows a case where an external HTTP request accounted for most of the page loading time
X-Ray App in cPanel
X-Ray App in cPanel
Review External Requests
If the issue involves a slow outbound connection, check the External Requests summary. This can help identify theme or plugin code responsible for calling slow or unreachable third-party services. In the referenced example, PHP X-Ray traced the issue back to a WordPress theme file making a slow external request.
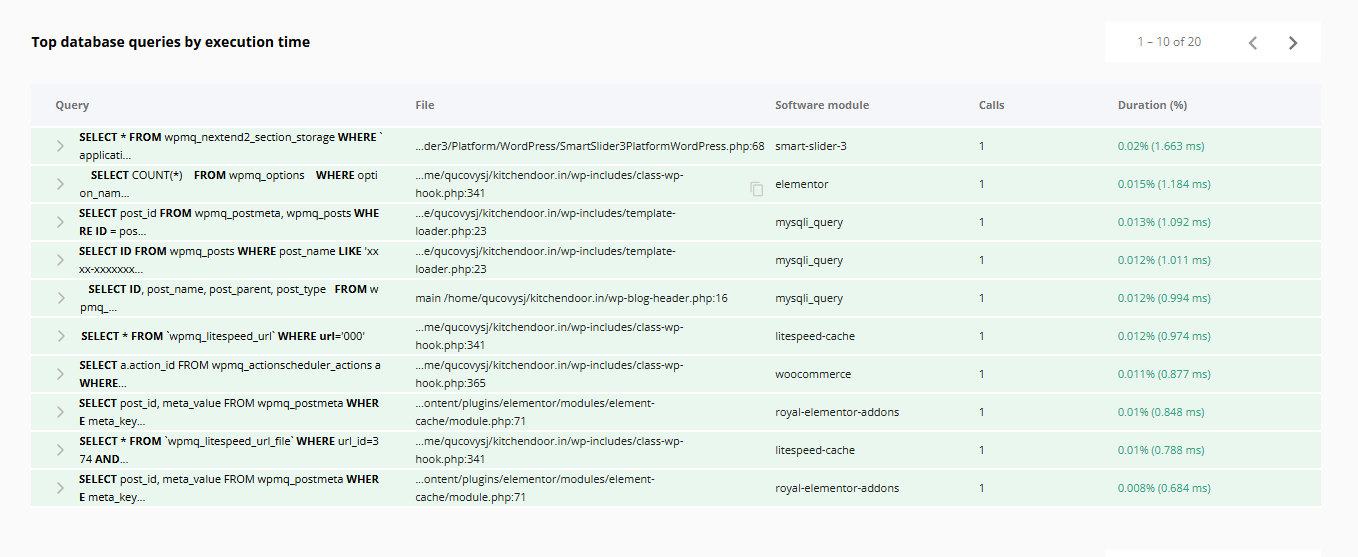
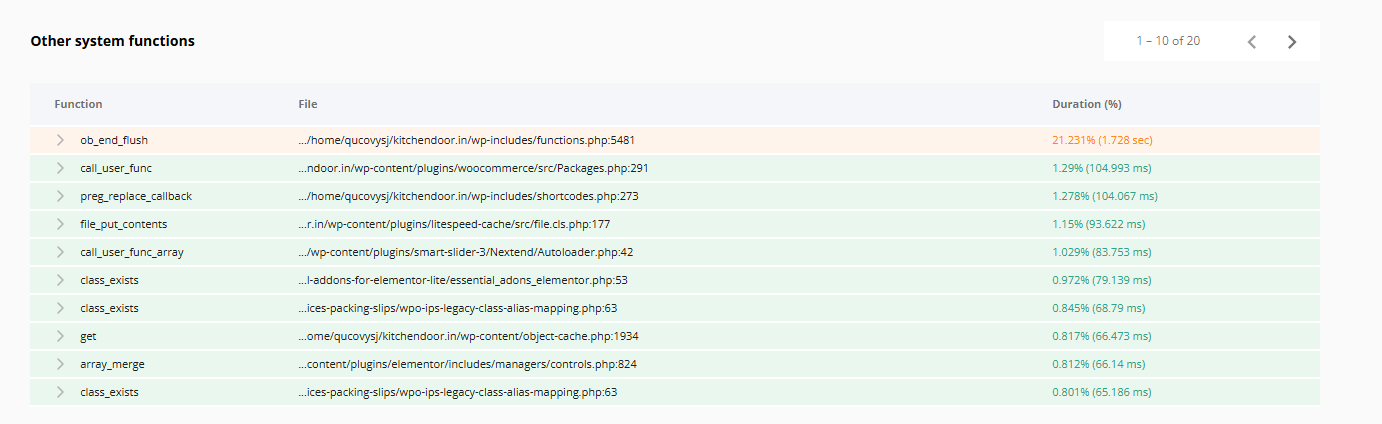
Review Database Queries and Function Calls
If the slowdown is not caused by an external request, the report can still help by showing details such as the top database queries by execution time, PHP call stack information, system function calls, and the related source file and line references. These details can help identify whether the issue is caused by custom code, a plugin, a theme function, or inefficient database queries.
X-Ray App in cPanel
X-Ray App in cPanel
Common Use Cases and Best Practices
PHP X-Ray is especially useful when a WordPress site becomes slow after installing a plugin, when a cPanel account shows high CPU usage, when only certain pages load slowly, when an external API or licensing server delays page generation, or when a theme or plugin triggers expensive database queries. For more accurate troubleshooting, it is recommended to temporarily disable caching before testing, trace a specific page first if the issue affects only one URL, use your own IP to isolate test traffic if needed, generate real requests while tracing is active, and review the top issues first before checking detailed functions and queries
Wrapping Up
PHP X-Ray is an essential tool for any website owner dealing with “mysterious” performance drops. By moving beyond basic resource monitoring and into deep-level request tracing, you can identify exactly which plugin, theme, or query is slowing down your user experience. Regularly using this tool during site development or after major updates ensures your WordPress site remains lean, fast, and reliable.